FAQ DOMAIN 6 Agile Problem Detection and Resolution
Tools and Techniques :
Control limits
Control limits are a concept from manufacturing process control, where statistically calculated upper and lower limits are used to help determine the acceptable variation in a process. However, in an agile context, control limits have a much looser interpretation that includes tolerance levels and warning signs. Such limits can help us diagnose issues before they occur or provide guidelines for us to operate within. Some of the agile recommendations or rules of thumb, such as limiting teams to 12 or fewer members, could be interpreted as control limits.
One way we can use control limits on an agile project is to monitor our velocity to gauge how likely it is that we will be able to complete the agreed-upon work by the release date. For example, if we have 600 points worth of functionality left in the backlog and 10 months until deployment preparations begin, we should set our lower control limit at 60pointsper month(600 / 10= 60), since that’s the minimum Velocity required to meet this goal.

Cycle time
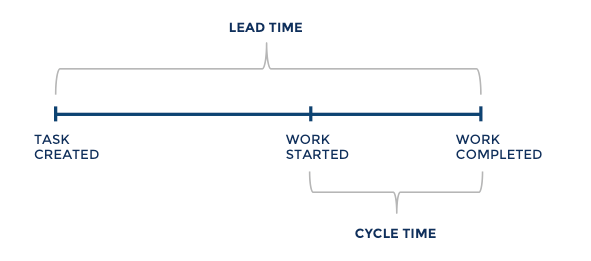
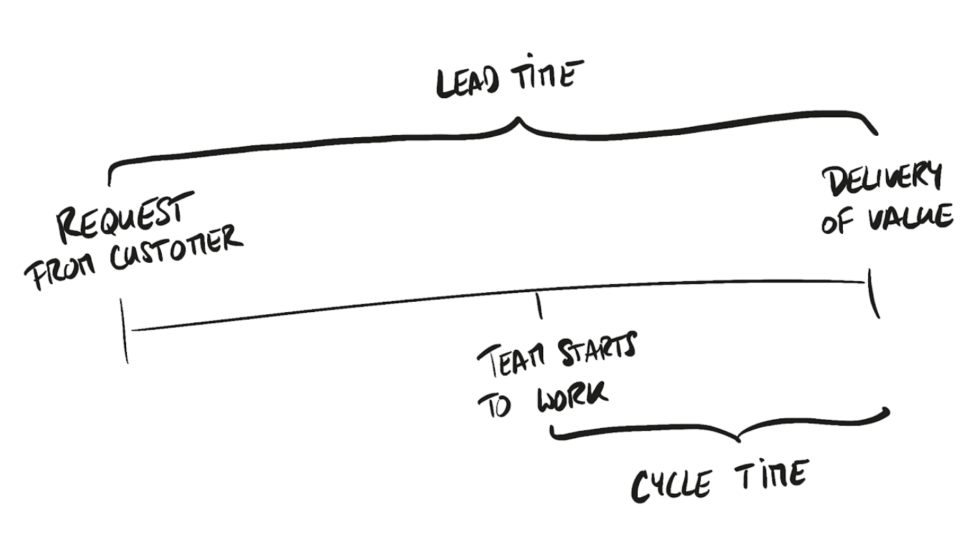
Cycle time is a measure of the elapsed time when work starts on an item (story, task, bug etc.) until it’s ready for delivery. Cycle time tells how long (in calendar time) it takes to complete a task.
Defect rate

Unfortunately, no matter how hard we try to identify and prevent defects, there may be an occasional defect that makes it through all our tests and quality control processes and ends up in the final product,(in software development, these are called escaped defects.) Defects that are missed by testing are the most costly kinds of defects to fix since they are on the top right end of the cost of the change curve. By the time we learn about such a defect, it is obviously too late to prevent it, but we can use this information to improve our processes going forward and hopefully reduce the number of defects of that nature in the future.
Defect detection percentage is another important agile testing metrics to determine the quality of your testing process. DDP measures the overall quality of your company’s testing process. It is the ratio of a number of defects identified during testing divided by total defects identified in that phase.
Lead time
The Lead Time measures the time from the moment the customer makes a request to the time they receive something.
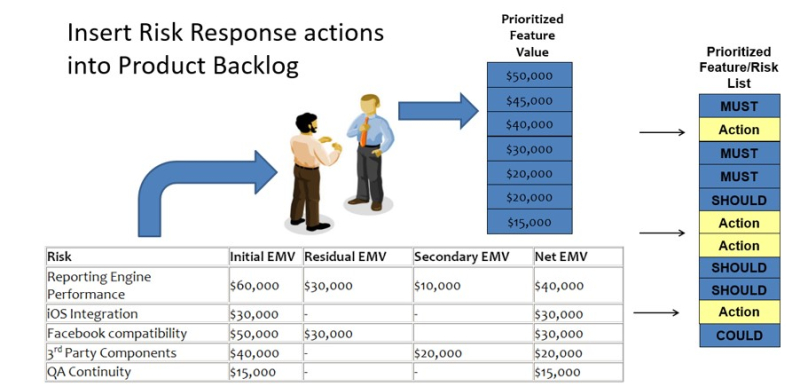
5. Risk-adjusted backlog
The risk-adjusted backlog is a sprint or release backlog containing risk response tasks for actionable risks. For negative risks, these actions include avoiding, mitigating, and transferring. For positive risks, they include exploiting, enhancing, and sharing.
Working with Product Owners or business representatives to add threat avoidance and mitigation work along with opportunity enablement work into the backlog.
6. Risk burndown graphs
A burndown chart is one such tool for collecting that project data. Using a burndown chart is a means of seeing how much work is left and how much time there is to do it in. It’s a graphical representation, offering in a picture what a thousand words might not be able to communicate as clearly.
Most projects willhave alonger list of threats andissues than shownin the example we just saw.But evenin these tables, allthe numbers makeit difficult to detect trends andunderstandwhat is really happening. To make sense of all this data,wehave to putinsome effort and take time to study the details.
This is where anotherkey agile toolcomes into the picture,reflecting the agile emphasis onfast, visual communication. To make the datain the above risk severity table easier to grasp at a glance,we can convert the numbersinto ariskburndowngraph,like this:


Riskburndown graphs are essentially stacked area graphs of cumulative project risk severity. The severity scores for each risk are plotted one ontop of another to show the project s cumulative severityprofile. Whenrisks andtheir history of severity are displayedinthis format,it is mucheasier to interpret the overallrisk status and trends of theproject.
7. Throughput/productivity
In Agile, throughput measures the average number of work items processed per unit of time. In a Kanban system, for example, as work is visualized in cards, throughput is measured based on how many Kanban cards were finished in a given period (weekly, monthly, etc.)
8. Variance and trend analysis
Variance is the measure ofhow far apart things are, orhow much they vary from each other.For example, ifyou ask multiple people to estimate the same job, there willbe some variance (differences) between their estimates. And once the work has been executed, there willbe a variance (difference) between the closest estimate and the actual results.Much variance is normal and shouldbe expected—we just want to keepit within acceptable limits.Ifit fluctuatesbeyond the acceptable limits, then we need toknow so we can take action.
When evaluatingperformance or trackingresults, we should understand that there willalways be a certain amount ofvariance due to normal fluctuation.Evenhighly engineeredprocesses have to take into account some degree ofnormal variation.We don’t want to mistake this normal variation for a significant outcome or trend, or vice versa.Weusually assume that normalvariationis likebackgroundnoise—too small tobe mistaken for the performance outcomes we are tryingto measure—but this isn’t always the case.
Knowledge and Skills:
9. Problem-solving
Problem-solving in agile as continuous improvement
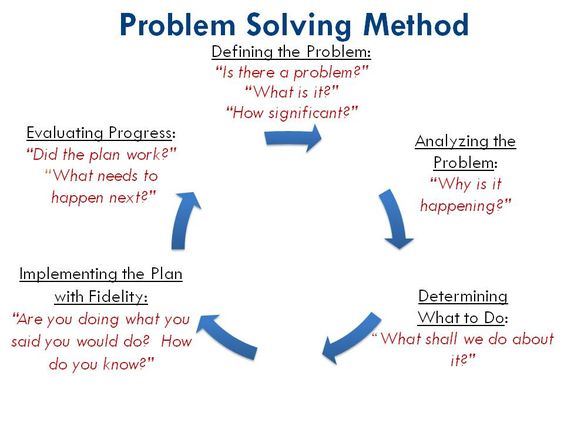
Agilemethods don’t rely ona reactive approach of“fix theproblem after it arises.”Instead, theyinclude focused efforts to identifypotentialissues duringthe iteration reviews andretrospectives that are done at the end of eachiteration. This minimizes the need for adhocproblem solvingduring the iterations.
Another way of saying thisis that agile methods consider the team’s lessons learned tobe too important to be reserveduntil the end of the project. Therefore, they include iterative opportunities for the team to capture those lessons,probe the strengths and weaknesses of their approach, and ensure that their mistakes won’t be repeated. These team-based “problem solving” efforts are actuallypart of the continuous improvement process. Reflecting that emphasis, in this chapter we have been discussing agile problem solving conceptually,but we’Uleave the details ofhowit is actually done for the next chapter (“Continuous Improvement”), where we’ll examine the problem-solving steps that are done in the retrospective process.
No comments:
Post a Comment