JS

Pages

Showing posts with label IELTS Writing Task1. Show all posts

Saturday, April 10, 2021

The diagram gives information about the process of making carbonated drinks.

 You should spend about 20 minutes on this task.

The diagram gives information about the process of making carbonated drinks.

Summarise the information by selecting and reporting the main features, and make comparisons where relevant.

You should write at least 150 words.

Writing task 1 

Some people think students should study the science of food and how to prepare it. Others think that school time should be used in learning important subjects.

You should spend about 40 minutes on this task.

Some people think students should study the science of food and how to prepare it. Others think that school time should be used in learning important subjects. Discuss both views and give your opinion?

Give reasons for your answer, and include any relevant examples from your own knowledge or experience.

You should write at least 250 words.

The chart shows the unemployment situation in Australia in the year 2012.


Writing task 1


You should spend about 20 minutes on this task. 

The chart shows the unemployment situation in Australia in the year 2012. 

Summarise the information by selecting and reporting the main features, and make comparisons where relevant. You should write at least 150 words.

Computer ownership as a percentage of the population between 2002 and 2010 and by level of education for the years 2002 and 2010.


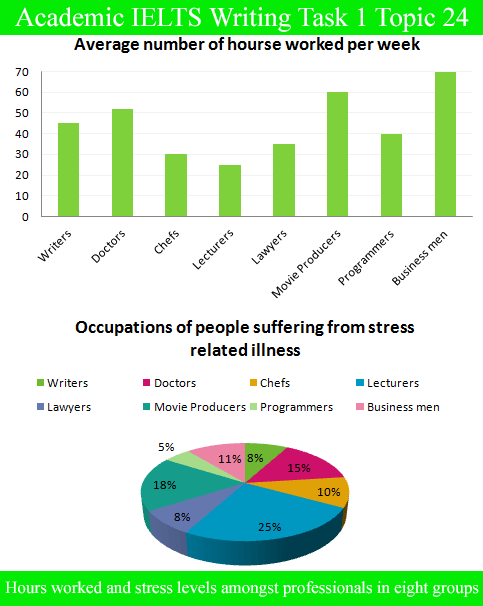
Average number of hours worked per week


Two graphs give different information related to eight professional groups. The bar chart indicates the number of weekly work hours done by the groups while the pie graph illustrates the percentages of people suffering from stress related illness in the different professions given.


People’s coffee and tea purchased and drinking habits in five Australian cities


The given diagram chart depicts related people’s coffee and tea purchased and drinking habits in five Australian cities, where illustrates shows the results of a survey and comparison among them.